Great Britian YouTube EDA

YouTube Trending Statistics Exploration in Python
Published on May 21, 2020 by Udbhav Pangotra
pandas numpy plotly matplotlib seaborn
45 min READ
YouTube Trending Statistics Exploration in Python
This notebook will walk you through some preliminary data exploration process of the YouTube Trending dataset, specifically the US dataset
# This Python 3 environment comes with many helpful analytics libraries installed
# It is defined by the kaggle/python Docker image: https://github.com/kaggle/docker-python
# For example, here's several helpful packages to load

import numpy as np # linear algebra
import pandas as pd # data processing, CSV file I/O (e.g. pd.read_csv)

# Input data files are available in the read-only "../input/" directory
# For example, running this (by clicking run or pressing Shift+Enter) will list all files under the input directory

import os
for dirname, _, filenames in os.walk('/kaggle/input'):
    for filename in filenames:
        print(os.path.join(dirname, filename))

# You can write up to 20GB to the current directory (/kaggle/working/) that gets preserved as output when you create a version using "Save & Run All"
# You can also write temporary files to /kaggle/temp/, but they won't be saved outside of the current session
/kaggle/input/youtube-new/GBvideos.csv
/kaggle/input/youtube-new/MXvideos.csv
/kaggle/input/youtube-new/KRvideos.csv
/kaggle/input/youtube-new/MX_category_id.json
/kaggle/input/youtube-new/GB_category_id.json
/kaggle/input/youtube-new/US_category_id.json
/kaggle/input/youtube-new/IN_category_id.json
/kaggle/input/youtube-new/DEvideos.csv
/kaggle/input/youtube-new/KR_category_id.json
/kaggle/input/youtube-new/RU_category_id.json
/kaggle/input/youtube-new/FRvideos.csv
/kaggle/input/youtube-new/USvideos.csv
/kaggle/input/youtube-new/INvideos.csv
/kaggle/input/youtube-new/RUvideos.csv
/kaggle/input/youtube-new/CA_category_id.json
/kaggle/input/youtube-new/DE_category_id.json
/kaggle/input/youtube-new/JP_category_id.json
/kaggle/input/youtube-new/JPvideos.csv
/kaggle/input/youtube-new/FR_category_id.json
/kaggle/input/youtube-new/CAvideos.csv
I will just import some basic python libaries :
import pandas as pd
import numpy as np
import seaborn as sns
import matplotlib.pyplot as plt
import matplotlib as mpl
import os
from subprocess import check_output
from wordcloud import WordCloud, STOPWORDS
Importing the GB data
df_yout = pd.read_csv("/kaggle/input/youtube-new/GBvideos.csv")
Just checking the shape of the dataset and the unique values in the respective lines.
print(df_yout.shape)
print(df_yout.nunique())
(38916, 16)
video_id                   3272
trending_date               205
title                      3369
channel_title              1625
category_id                  16
publish_time               3250
tags                       3122
views                     38393
likes                     30556
dislikes                  11092
comment_count             15778
thumbnail_link             3272
comments_disabled             2
ratings_disabled              2
video_error_or_removed        2
description                3704
dtype: int64
Just a simple check on the kind of data in each column and the number of the null values. Only discription has some null values rest all the columns have some value in them.
df_yout.info()
<class 'pandas.core.frame.DataFrame'>
RangeIndex: 38916 entries, 0 to 38915
Data columns (total 16 columns):
 #   Column                  Non-Null Count  Dtype
---  ------                  --------------  -----
 0   video_id                38916 non-null  object
 1   trending_date           38916 non-null  object
 2   title                   38916 non-null  object
 3   channel_title           38916 non-null  object
 4   category_id             38916 non-null  int64
 5   publish_time            38916 non-null  object
 6   tags                    38916 non-null  object
 7   views                   38916 non-null  int64
 8   likes                   38916 non-null  int64
 9   dislikes                38916 non-null  int64
 10  comment_count           38916 non-null  int64
 11  thumbnail_link          38916 non-null  object
 12  comments_disabled       38916 non-null  bool
 13  ratings_disabled        38916 non-null  bool
 14  video_error_or_removed  38916 non-null  bool
 15  description             38304 non-null  object
dtypes: bool(3), int64(5), object(8)
memory usage: 4.0+ MB
Lets now see the top 3 rows of the data we have.
df_yout.head(3)
| video_id | trending_date | title | channel_title | category_id | publish_time | tags | views | likes | dislikes | comment_count | thumbnail_link | comments_disabled | ratings_disabled | video_error_or_removed | description | |
|---|---|---|---|---|---|---|---|---|---|---|---|---|---|---|---|---|
| 0 | Jw1Y-zhQURU | 17.14.11 | John Lewis Christmas Ad 2017 - #MozTheMonster | John Lewis | 26 | 2017-11-10T07:38:29.000Z | christmas|"john lewis christmas"|"john lewis"|... | 7224515 | 55681 | 10247 | 9479 | https://i.ytimg.com/vi/Jw1Y-zhQURU/default.jpg | False | False | False | Click here to continue the story and make your... |
| 1 | 3s1rvMFUweQ | 17.14.11 | Taylor Swift: …Ready for It? (Live) - SNL | Saturday Night Live | 24 | 2017-11-12T06:24:44.000Z | SNL|"Saturday Night Live"|"SNL Season 43"|"Epi... | 1053632 | 25561 | 2294 | 2757 | https://i.ytimg.com/vi/3s1rvMFUweQ/default.jpg | False | False | False | Musical guest Taylor Swift performs …Ready for... |
| 2 | n1WpP7iowLc | 17.14.11 | Eminem - Walk On Water (Audio) ft. Beyoncé | EminemVEVO | 10 | 2017-11-10T17:00:03.000Z | Eminem|"Walk"|"On"|"Water"|"Aftermath/Shady/In... | 17158579 | 787420 | 43420 | 125882 | https://i.ytimg.com/vi/n1WpP7iowLc/default.jpg | False | False | False | Eminem's new track Walk on Water ft. Beyoncé i... |
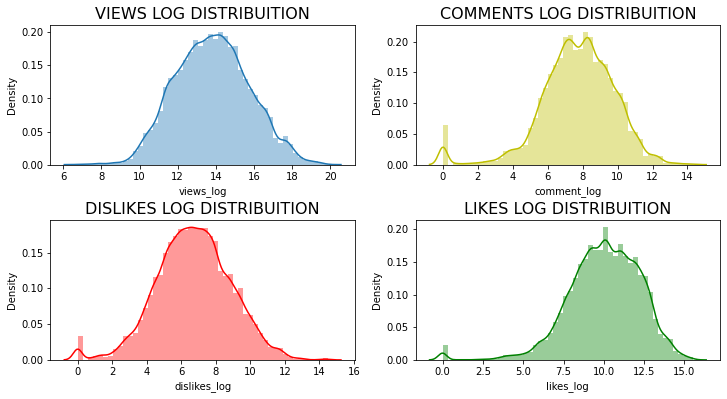
Lets check if Views, Likes, Dislikes and Comments follow a normal distribuition
df_yout['likes_log'] = np.log(df_yout['likes'] + 1)
df_yout['views_log'] = np.log(df_yout['views'] + 1)
df_yout['dislikes_log'] = np.log(df_yout['dislikes'] + 1)
df_yout['comment_log'] = np.log(df_yout['comment_count'] + 1)

plt.figure(figsize = (12,6))

plt.subplot(221)
g1 = sns.distplot(df_yout['views_log'])
g1.set_title("VIEWS LOG DISTRIBUITION", fontsize=16)

plt.subplot(224)
g2 = sns.distplot(df_yout['likes_log'],color='green')
g2.set_title('LIKES LOG DISTRIBUITION', fontsize=16)

plt.subplot(223)
g3 = sns.distplot(df_yout['dislikes_log'], color='r')
g3.set_title("DISLIKES LOG DISTRIBUITION", fontsize=16)

plt.subplot(222)
g4 = sns.distplot(df_yout['comment_log'], color = 'y')
g4.set_title("COMMENTS LOG DISTRIBUITION", fontsize=16)

plt.subplots_adjust(wspace = 0.2, hspace = 0.4,top = 0.9)

plt.show()
/opt/conda/lib/python3.7/site-packages/seaborn/distributions.py:2557: FutureWarning: `distplot` is a deprecated function and will be removed in a future version. Please adapt your code to use either `displot` (a figure-level function with similar flexibility) or `histplot` (an axes-level function for histograms).
  warnings.warn(msg, FutureWarning)
pd.set_option('display.float_format', lambda x: '%.2f' % x)
print("Let's now describe these 4 columns : Views, Likes, Dislikes, Comments ")
print(round(df_yout[['views','likes','dislikes','comment_count']].describe(),2))
pd.reset_option('display.float_format')
Let's now describe these 4 columns : Views, Likes, Dislikes, Comments
             views      likes   dislikes  comment_count
count     38916.00   38916.00   38916.00       38916.00
mean    5911943.63  134519.55    7612.56       13088.35
std    19001209.95  349989.31   50956.83       50667.40
min         851.00       0.00       0.00           0.00
25%      251527.25    5897.00     200.00         679.00
50%      981889.00   25182.50     821.00        2478.00
75%     3683628.50  114089.25    3357.50        9241.50
max   424538912.00 5613827.00 1944971.00     1626501.00
df_yout['category_name'] = np.nan

df_yout.loc[(df_yout["category_id"] == 1),"category_name"] = 'Film and Animation'
df_yout.loc[(df_yout["category_id"] == 2),"category_name"] = 'Cars and Vehicles'
df_yout.loc[(df_yout["category_id"] == 10),"category_name"] = 'Music'
df_yout.loc[(df_yout["category_id"] == 15),"category_name"] = 'Pets and Animals'
df_yout.loc[(df_yout["category_id"] == 17),"category_name"] = 'Sport'
df_yout.loc[(df_yout["category_id"] == 19),"category_name"] = 'Travel and Events'
df_yout.loc[(df_yout["category_id"] == 20),"category_name"] = 'Gaming'
df_yout.loc[(df_yout["category_id"] == 22),"category_name"] = 'People and Blogs'
df_yout.loc[(df_yout["category_id"] == 23),"category_name"] = 'Comedy'
df_yout.loc[(df_yout["category_id"] == 24),"category_name"] = 'Entertainment'
df_yout.loc[(df_yout["category_id"] == 25),"category_name"] = 'News and Politics'
df_yout.loc[(df_yout["category_id"] == 26),"category_name"] = 'How to and Style'
df_yout.loc[(df_yout["category_id"] == 27),"category_name"] = 'Education'
df_yout.loc[(df_yout["category_id"] == 28),"category_name"] = 'Science and Technology'
df_yout.loc[(df_yout["category_id"] == 29),"category_name"] = 'Non Profits and Activism'
df_yout.loc[(df_yout["category_id"] == 25),"category_name"] = 'News & Politics'
Looking the Views, likes, dislikes distribuition by category names.
plt.figure(figsize = (14,9))

plt.subplot(311)
g = sns.countplot('category_name', data=df_yout, palette="Set1")
g.set_xticklabels(g.get_xticklabels(),rotation=45)
g.set_title("Counting the Video Category's ", fontsize=15)
g.set_xlabel("", fontsize=12)
g.set_ylabel("Count", fontsize=12)

plt.subplot(312)
g1 = sns.boxplot(x='category_name', y='views_log', data=df_yout, palette="Set1")
g1.set_xticklabels(g.get_xticklabels(),rotation=45)
g1.set_title("Views Distribuition by Category Names", fontsize=20)
g1.set_xlabel("", fontsize=15)
g1.set_ylabel("Views(log)", fontsize=15)

plt.subplot(313)
g1 = sns.boxplot(x='category_name',y='comment_log', data=df_yout, palette="Set1")
g1.set_xticklabels(g.get_xticklabels(),rotation=45)
g1.set_title("Comments Distribuition by Category Names", fontsize=20)
g1.set_xlabel("", fontsize=15)
g1.set_ylabel("Comments", fontsize=15)


plt.subplots_adjust(hspace = 0.9, top = 0.9)

plt.show()
/opt/conda/lib/python3.7/site-packages/seaborn/_decorators.py:43: FutureWarning: Pass the following variable as a keyword arg: x. From version 0.12, the only valid positional argument will be `data`, and passing other arguments without an explicit keyword will result in an error or misinterpretation.
  FutureWarning
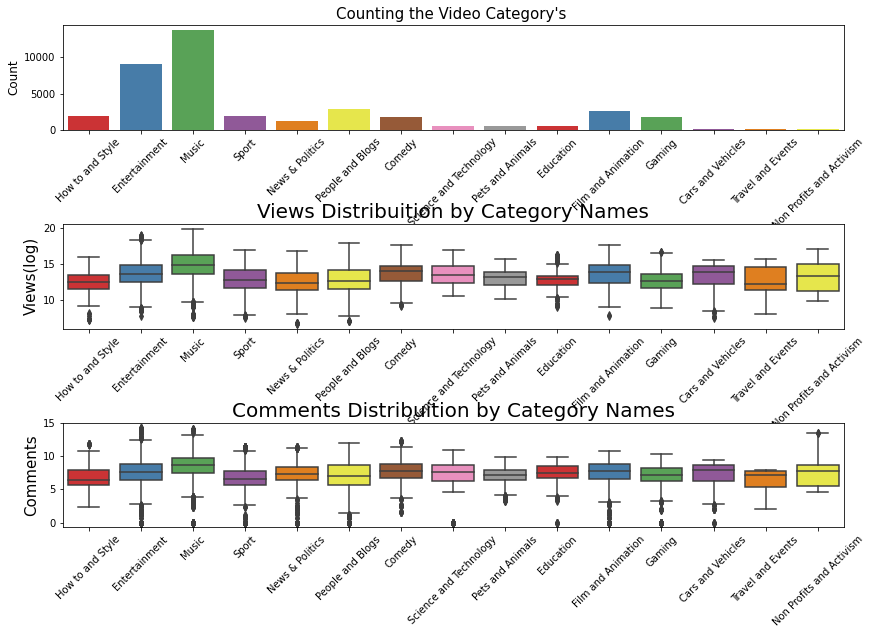
Significant number of music and entertainment videos, gaming and sports are more common thann education.
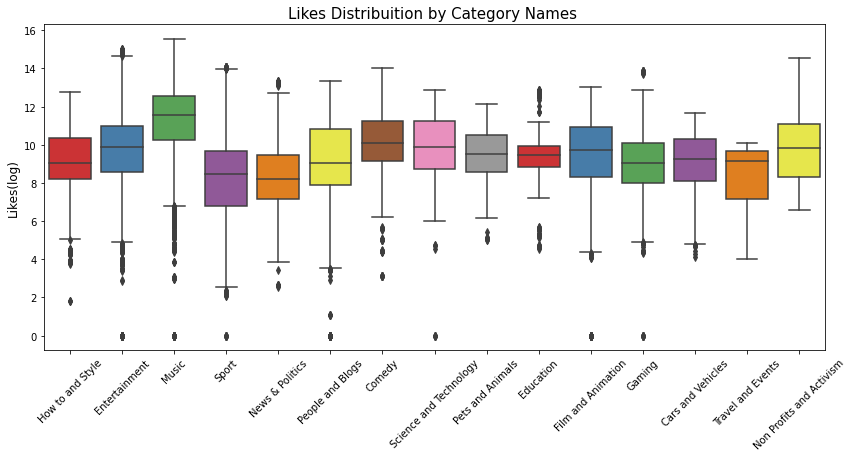
print('Looking the Likes distribuition by category names')
plt.figure(figsize = (14,6))

g = sns.boxplot(x='category_name', y='likes_log', data=df_yout, palette="Set1")
g.set_xticklabels(g.get_xticklabels(),rotation=45)
g.set_title("Likes Distribuition by Category Names ", fontsize=15)
g.set_xlabel("", fontsize=12)
g.set_ylabel("Likes(log)", fontsize=12)
plt.show()
Looking the Likes distribuition by category names
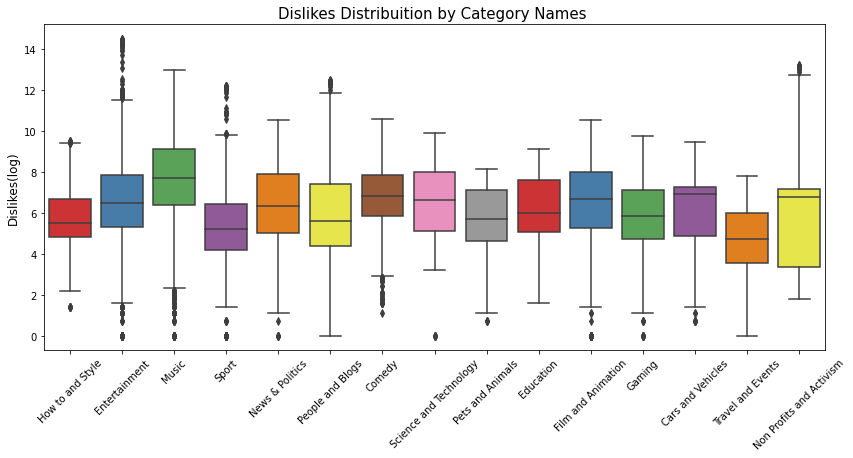
print('Looking the Dislikes distribuition by category names')
plt.figure(figsize = (14,6))

g = sns.boxplot(x='category_name', y='dislikes_log', data=df_yout, palette="Set1")
g.set_xticklabels(g.get_xticklabels(),rotation=45)
g.set_title("Dislikes Distribuition by Category Names ", fontsize=15)
g.set_xlabel("", fontsize=12)
g.set_ylabel("Dislikes(log)", fontsize=12)
plt.show()
Looking the Dislikes distribuition by category names
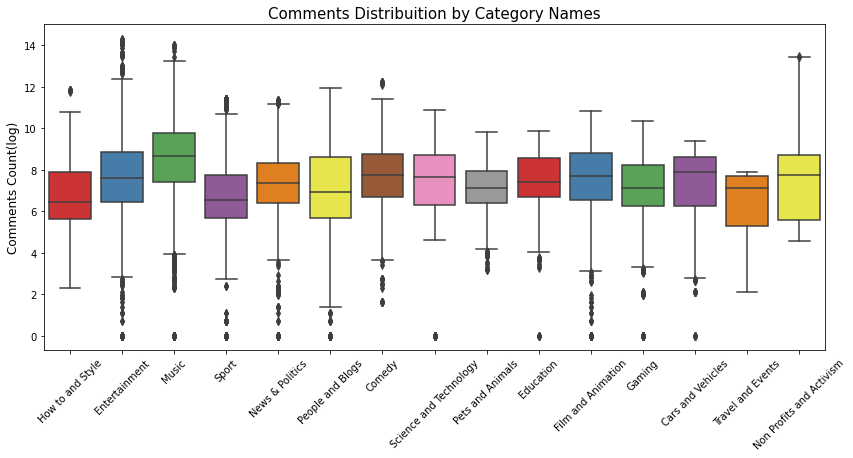
print('Comments Distribuition by Category Names')
plt.figure(figsize = (14,6))

g = sns.boxplot(x='category_name', y='comment_log', data=df_yout, palette="Set1")
g.set_xticklabels(g.get_xticklabels(),rotation=45)
g.set_title("Comments Distribuition by Category Names", fontsize=15)
g.set_xlabel("", fontsize=12)
g.set_ylabel("Comments Count(log)", fontsize=12)

plt.show()
Comments Distribuition by Category Names
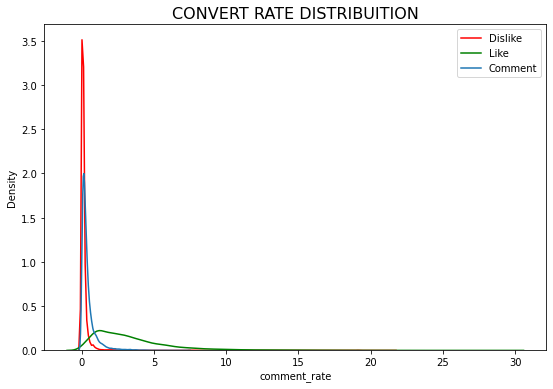
Engagement Features
I will create some new variables to us analyse the percent of likes, dislikes, comment by each category to discover what category have the highest engagement
df_yout['like_rate'] =  df_yout ['likes'] / df_yout['views'] * 100
df_yout['dislike_rate'] =  df_yout ['dislikes'] / df_yout['views'] * 100
df_yout['comment_rate'] =  df_yout ['comment_count'] / df_yout['views'] * 100
print('CONVERT RATE DISTRIBUITION')
plt.figure(figsize = (9,6))

g1 = sns.distplot(df_yout['dislike_rate'], color='red',hist=False, label="Dislike")
g1 = sns.distplot(df_yout['like_rate'], color='green',hist=False, label="Like")
g1 = sns.distplot(df_yout['comment_rate'],hist=False,label="Comment")
g1.set_title('CONVERT RATE DISTRIBUITION', fontsize=16)
plt.legend()
plt.show()
CONVERT RATE DISTRIBUITION


/opt/conda/lib/python3.7/site-packages/seaborn/distributions.py:2557: FutureWarning: `distplot` is a deprecated function and will be removed in a future version. Please adapt your code to use either `displot` (a figure-level function with similar flexibility) or `kdeplot` (an axes-level function for kernel density plots).
  warnings.warn(msg, FutureWarning)
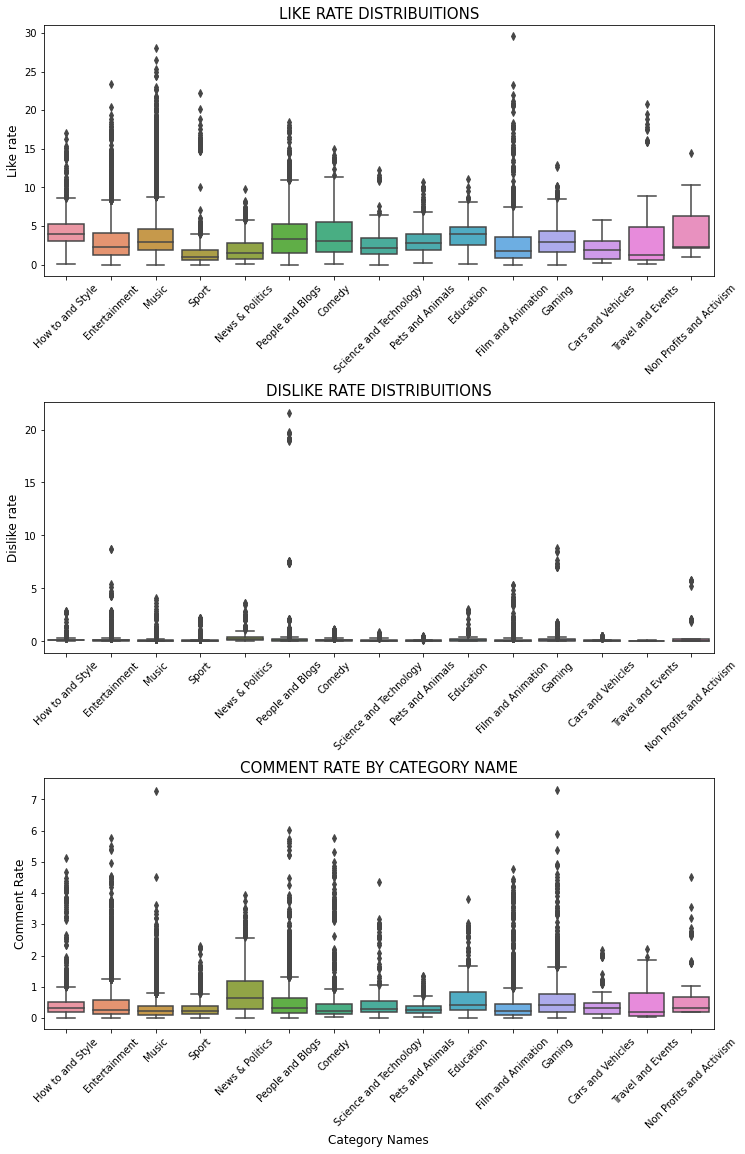
print('Like, Dislike, Comment Rate Distribution')
plt.figure(figsize = (12,18))

plt.subplot(311)
g= sns.boxplot(x='category_name',y='like_rate',  data=df_yout)
g.set_xticklabels(g.get_xticklabels(),rotation=45)
g.set_title("LIKE RATE DISTRIBUITIONS", fontsize=15)
g.set_xlabel("", fontsize=12)
g.set_ylabel("Like rate", fontsize=12)

plt.subplot(312)
g1= sns.boxplot(y='dislike_rate', x='category_name', data=df_yout)
g1.set_xticklabels(g.get_xticklabels(),rotation=45)
g1.set_title("DISLIKE RATE DISTRIBUITIONS", fontsize=15)
g1.set_xlabel("", fontsize=12)
g1.set_ylabel("Dislike rate", fontsize=12)

plt.subplot(313)
g2= sns.boxplot(y='comment_rate', x='category_name', data=df_yout)
g2.set_xticklabels(g.get_xticklabels(),rotation=45)
g2.set_title("COMMENT RATE BY CATEGORY NAME", fontsize=15)
g2.set_xlabel("Category Names", fontsize=12)
g2.set_ylabel("Comment Rate", fontsize=12)

plt.subplots_adjust(wspace = 0.2, hspace = 0.5,top = 0.9)

plt.show()
Like, Dislike, Comment Rate Distribution
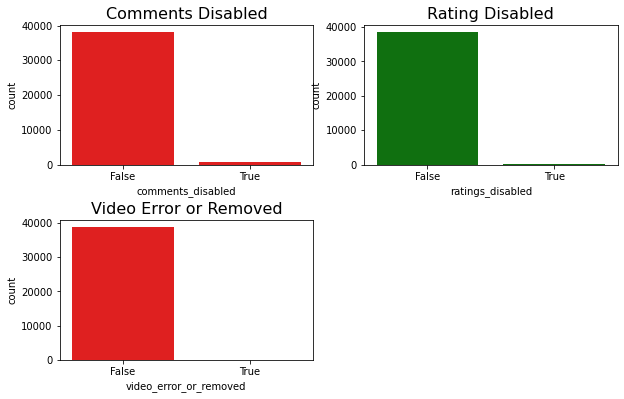
Looking through the anothers categoricals variables We have the variables:
- Comments Disable
- Rating disable
- Video error
plt.figure(figsize = (10,6))
plt.subplots_adjust(wspace = 0.2, hspace = 0.4,top = 0.9)

plt.subplot(2,2,1)
g = sns.countplot(x='comments_disabled', data=df_yout,color ='r')
g.set_title("Comments Disabled", fontsize=16)

plt.subplot(2,2,2)
g1 = sns.countplot(x='ratings_disabled', data=df_yout, color ='g')
g1.set_title("Rating Disabled", fontsize=16)

plt.subplot(2,2,3)
g2 = sns.countplot(x='video_error_or_removed', data=df_yout,color ='r')
g2.set_title("Video Error or Removed", fontsize=16)
plt.show()
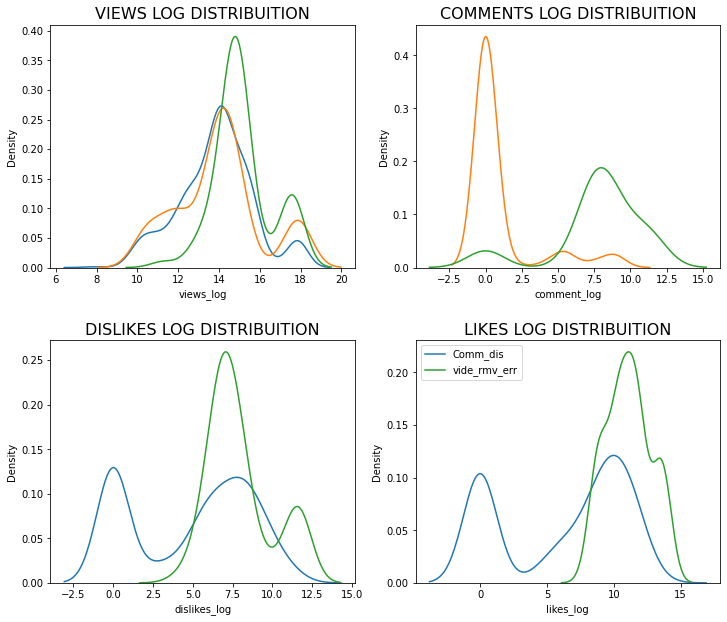
Let’s look the kde of this variables separated to deep understand them
plt.figure(figsize = (12,10))

plt.subplot(221)
g1 = sns.distplot(df_yout[df_yout['comments_disabled'] == True]['views_log'],
                  hist=False, label='Comm_dis')
g1 = sns.distplot(df_yout[df_yout['ratings_disabled'] == True]['views_log'],
                  hist=False, label='Rati_dis')
g1 = sns.distplot(df_yout[df_yout['video_error_or_removed'] == True]['views_log'],
                  hist=False, label='vide_rmv_err')
g1.set_title("VIEWS LOG DISTRIBUITION", fontsize=16)

plt.subplot(222)
g4 = sns.distplot(df_yout[df_yout['comments_disabled'] == True]['comment_log'],
                  hist=False, label='Comm_dis')
g4 = sns.distplot(df_yout[df_yout['ratings_disabled'] == True]['comment_log'],
                  hist=False, label='Rati_dis')
g4 = sns.distplot(df_yout[df_yout['video_error_or_removed'] == True]['comment_log'],
                  hist=False, label='vide_rmv_err')
g4.set_title("COMMENTS LOG DISTRIBUITION", fontsize=16)

plt.subplot(223)
g3 = sns.distplot(df_yout[df_yout['comments_disabled'] == True]['dislikes_log'],
                  hist=False, label='Comm_dis')
g3 = sns.distplot(df_yout[df_yout['ratings_disabled'] == True]['dislikes_log'],
                  hist=False, label='Rati_dis')
g3 = sns.distplot(df_yout[df_yout['video_error_or_removed'] == True]['dislikes_log'],
                  hist=False, label='vide_rmv_err')
g3.set_title("DISLIKES LOG DISTRIBUITION", fontsize=16)

plt.subplot(224)
g2 = sns.distplot(df_yout[df_yout['comments_disabled'] == True]['likes_log'],
                  hist=False, label='Comm_dis')
g2 = sns.distplot(df_yout[df_yout['ratings_disabled'] == True]['likes_log'],
                  hist=False, label='Rati_dis')
g2 = sns.distplot(df_yout[df_yout['video_error_or_removed'] == True]['likes_log'],
                  hist=False, label='vide_rmv_err')
g2.set_title('LIKES LOG DISTRIBUITION', fontsize=16)

plt.subplots_adjust(wspace = 0.2, hspace = 0.3,top = 0.9)
plt.legend()
plt.show()
/opt/conda/lib/python3.7/site-packages/seaborn/distributions.py:2557: FutureWarning: `distplot` is a deprecated function and will be removed in a future version. Please adapt your code to use either `displot` (a figure-level function with similar flexibility) or `kdeplot` (an axes-level function for kernel density plots).
  warnings.warn(msg, FutureWarning)
/opt/conda/lib/python3.7/site-packages/seaborn/distributions.py:306: UserWarning: Dataset has 0 variance; skipping density estimate.
  warnings.warn(msg, UserWarning)
/opt/conda/lib/python3.7/site-packages/seaborn/distributions.py:2557: FutureWarning: `distplot` is a deprecated function and will be removed in a future version. Please adapt your code to use either `displot` (a figure-level function with similar flexibility) or `kdeplot` (an axes-level function for kernel density plots).
  warnings.warn(msg, FutureWarning)
/opt/conda/lib/python3.7/site-packages/seaborn/distributions.py:306: UserWarning: Dataset has 0 variance; skipping density estimate.
  warnings.warn(msg, UserWarning)
/opt/conda/lib/python3.7/site-packages/seaborn/distributions.py:2557: FutureWarning: `distplot` is a deprecated function and will be removed in a future version. Please adapt your code to use either `displot` (a figure-level function with similar flexibility) or `kdeplot` (an axes-level function for kernel density plots).
  warnings.warn(msg, FutureWarning)
/opt/conda/lib/python3.7/site-packages/seaborn/distributions.py:2557: FutureWarning: `distplot` is a deprecated function and will be removed in a future version. Please adapt your code to use either `displot` (a figure-level function with similar flexibility) or `kdeplot` (an axes-level function for kernel density plots).
  warnings.warn(msg, FutureWarning)
/opt/conda/lib/python3.7/site-packages/seaborn/distributions.py:2557: FutureWarning: `distplot` is a deprecated function and will be removed in a future version. Please adapt your code to use either `displot` (a figure-level function with similar flexibility) or `kdeplot` (an axes-level function for kernel density plots).
  warnings.warn(msg, FutureWarning)
/opt/conda/lib/python3.7/site-packages/seaborn/distributions.py:306: UserWarning: Dataset has 0 variance; skipping density estimate.
  warnings.warn(msg, UserWarning)
/opt/conda/lib/python3.7/site-packages/seaborn/distributions.py:2557: FutureWarning: `distplot` is a deprecated function and will be removed in a future version. Please adapt your code to use either `displot` (a figure-level function with similar flexibility) or `kdeplot` (an axes-level function for kernel density plots).
  warnings.warn(msg, FutureWarning)
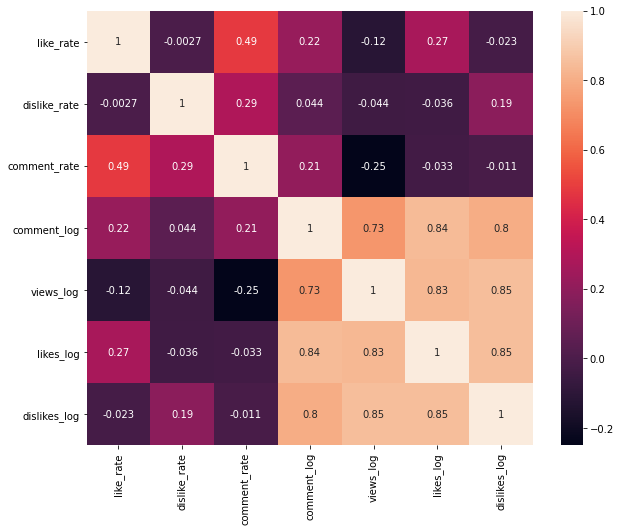
Analysing the Correlation Matrix of the numerical variables
plt.figure(figsize = (10,8))

#Let's verify the correlation of each value
sns.heatmap(df_yout[['like_rate', 'dislike_rate', 'comment_rate', 'comment_log',
         'views_log','likes_log','dislikes_log', "category_name"]].corr(), annot=True)
plt.show()
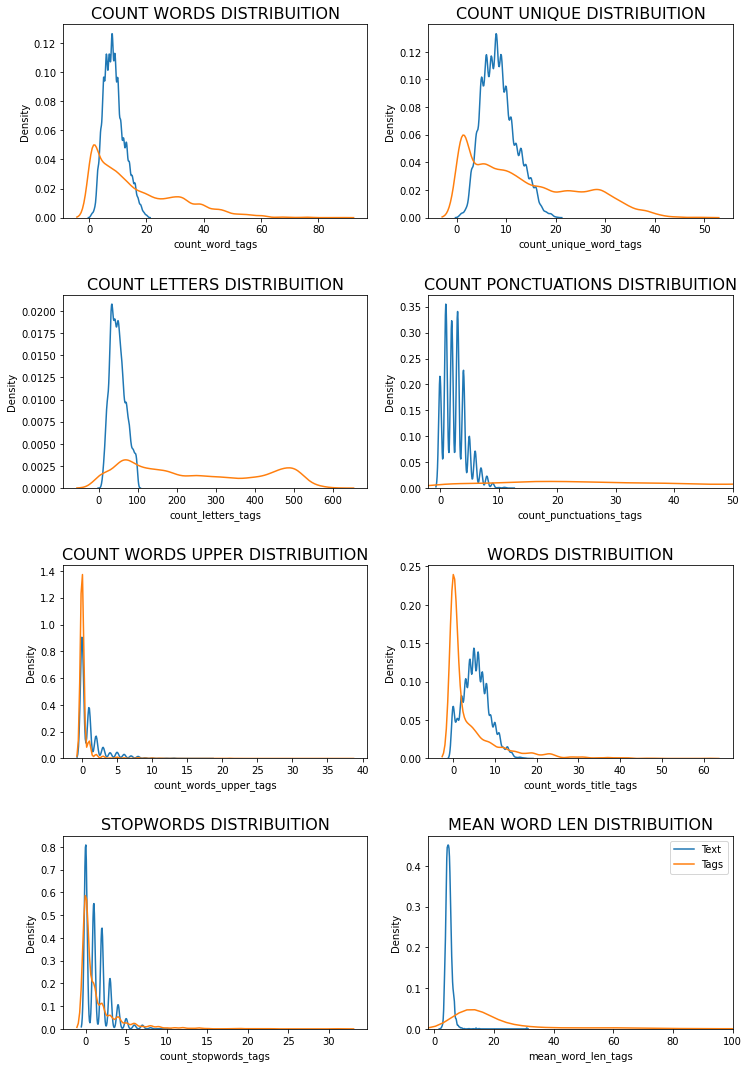
Lets move to some NLP analysis now
import string
import re
import nltk
from nltk.corpus import stopwords
import spacy
from nltk import pos_tag
from nltk.stem.wordnet import WordNetLemmatizer
from nltk.tokenize import word_tokenize
from nltk.tokenize import TweetTokenizer
eng_stopwords = set(stopwords.words("english"))
#Word count in each comment:
df_yout['count_word']=df_yout["title"].apply(lambda x: len(str(x).split()))
df_yout['count_word_tags']=df_yout["tags"].apply(lambda x: len(str(x).split()))

#Unique word count
df_yout['count_unique_word']=df_yout["title"].apply(lambda x: len(set(str(x).split())))
df_yout['count_unique_word_tags']=df_yout["tags"].apply(lambda x: len(set(str(x).split())))

#Letter count
df_yout['count_letters']=df_yout["title"].apply(lambda x: len(str(x)))
df_yout['count_letters_tags']=df_yout["tags"].apply(lambda x: len(str(x)))

#punctuation count
df_yout["count_punctuations"] =df_yout["title"].apply(lambda x: len([c for c in str(x) if c in string.punctuation]))
df_yout["count_punctuations_tags"] =df_yout["tags"].apply(lambda x: len([c for c in str(x) if c in string.punctuation]))

#upper case words count
df_yout["count_words_upper"] = df_yout["title"].apply(lambda x: len([w for w in str(x).split() if w.isupper()]))
df_yout["count_words_upper_tags"] = df_yout["tags"].apply(lambda x: len([w for w in str(x).split() if w.isupper()]))

#title case words count
df_yout["count_words_title"] = df_yout["title"].apply(lambda x: len([w for w in str(x).split() if w.istitle()]))
df_yout["count_words_title_tags"] = df_yout["tags"].apply(lambda x: len([w for w in str(x).split() if w.istitle()]))

#Number of stopwords
df_yout["count_stopwords"] = df_yout["title"].apply(lambda x: len([w for w in str(x).lower().split() if w in eng_stopwords]))
df_yout["count_stopwords_tags"] = df_yout["tags"].apply(lambda x: len([w for w in str(x).lower().split() if w in eng_stopwords]))

#Average length of the words
df_yout["mean_word_len"] = df_yout["title"].apply(lambda x: np.mean([len(w) for w in str(x).split()]))
df_yout["mean_word_len_tags"] = df_yout["tags"].apply(lambda x: np.mean([len(w) for w in str(x).split()]))
#derived features
#Word count percent in each comment:
df_yout['word_unique_percent']=df_yout['count_unique_word']*100/df_yout['count_word']
df_yout['word_unique_percent_tags']=df_yout['count_unique_word_tags']*100/df_yout['count_word_tags']

#Punct percent in each comment:
df_yout['punct_percent']=df_yout['count_punctuations']*100/df_yout['count_word']
df_yout['punct_percent_tags']=df_yout['count_punctuations_tags']*100/df_yout['count_word_tags']
plt.figure(figsize = (12,18))

plt.subplot(421)
g1 = sns.distplot(df_yout['count_word'],
                  hist=False, label='Text')
g1 = sns.distplot(df_yout['count_word_tags'],
                  hist=False, label='Tags')
g1.set_title("COUNT WORDS DISTRIBUITION", fontsize=16)

plt.subplot(422)
g2 = sns.distplot(df_yout['count_unique_word'],
                  hist=False, label='Text')
g2 = sns.distplot(df_yout['count_unique_word_tags'],
                  hist=False, label='Tags')
g2.set_title("COUNT UNIQUE DISTRIBUITION", fontsize=16)

plt.subplot(423)
g3 = sns.distplot(df_yout['count_letters'],
                  hist=False, label='Text')
g3 = sns.distplot(df_yout['count_letters_tags'],
                  hist=False, label='Tags')
g3.set_title("COUNT LETTERS DISTRIBUITION", fontsize=16)

plt.subplot(424)
g4 = sns.distplot(df_yout["count_punctuations"],
                  hist=False, label='Text')
g4 = sns.distplot(df_yout["count_punctuations_tags"],
                  hist=False, label='Tags')
g4.set_xlim([-2,50])
g4.set_title('COUNT PONCTUATIONS DISTRIBUITION', fontsize=16)

plt.subplot(425)
g5 = sns.distplot(df_yout["count_words_upper"] ,
                  hist=False, label='Text')
g5 = sns.distplot(df_yout["count_words_upper_tags"] ,
                  hist=False, label='Tags')
g5.set_title('COUNT WORDS UPPER DISTRIBUITION', fontsize=16)

plt.subplot(426)
g6 = sns.distplot(df_yout["count_words_title"],
                  hist=False, label='Text')
g6 = sns.distplot(df_yout["count_words_title_tags"],
                  hist=False, label='Tags')
g6.set_title('WORDS DISTRIBUITION', fontsize=16)

plt.subplot(427)
g7 = sns.distplot(df_yout["count_stopwords"],
                  hist=False, label='Title')
g7 = sns.distplot(df_yout["count_stopwords_tags"],
                  hist=False, label='Tags')
g7.set_title('STOPWORDS DISTRIBUITION', fontsize=16)

plt.subplot(428)
g8 = sns.distplot(df_yout["mean_word_len"],
                  hist=False, label='Text')
g8 = sns.distplot(df_yout["mean_word_len_tags"],
                  hist=False, label='Tags')
g8.set_xlim([-2,100])
g8.set_title('MEAN WORD LEN DISTRIBUITION', fontsize=16)

plt.subplots_adjust(wspace = 0.2, hspace = 0.4,top = 0.9)
plt.legend()
plt.show()
/opt/conda/lib/python3.7/site-packages/seaborn/distributions.py:2557: FutureWarning: `distplot` is a deprecated function and will be removed in a future version. Please adapt your code to use either `displot` (a figure-level function with similar flexibility) or `kdeplot` (an axes-level function for kernel density plots).
  warnings.warn(msg, FutureWarning)
/opt/conda/lib/python3.7/site-packages/seaborn/distributions.py:2557: FutureWarning: `distplot` is a deprecated function and will be removed in a future version. Please adapt your code to use either `displot` (a figure-level function with similar flexibility) or `kdeplot` (an axes-level function for kernel density plots).
  warnings.warn(msg, FutureWarning)
/opt/conda/lib/python3.7/site-packages/seaborn/distributions.py:2557: FutureWarning: `distplot` is a deprecated function and will be removed in a future version. Please adapt your code to use either `displot` (a figure-level function with similar flexibility) or `kdeplot` (an axes-level function for kernel density plots).
  warnings.warn(msg, FutureWarning)
/opt/conda/lib/python3.7/site-packages/seaborn/distributions.py:2557: FutureWarning: `distplot` is a deprecated function and will be removed in a future version. Please adapt your code to use either `displot` (a figure-level function with similar flexibility) or `kdeplot` (an axes-level function for kernel density plots).
  warnings.warn(msg, FutureWarning)
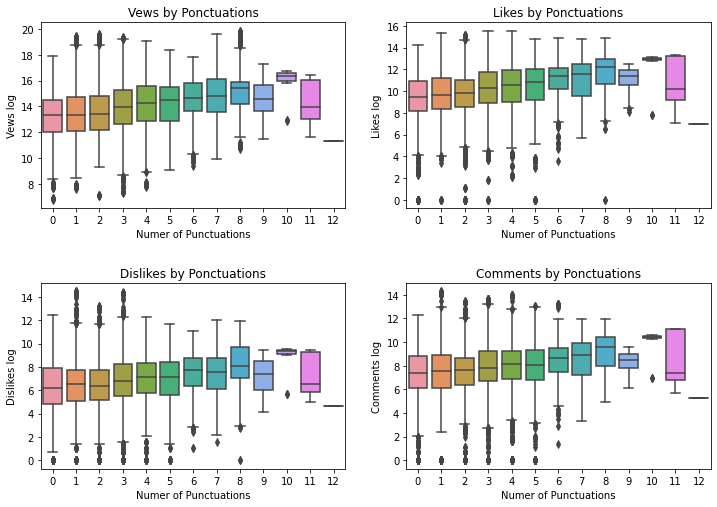
Have the Punctuations title and tags any relation with views, likes, dislikes comments?
plt.figure(figsize = (12,8))

plt.subplot(221)
g=sns.boxplot(x='count_punctuations', y='views_log',data=df_yout)
g.set_title("Vews by Ponctuations")
g.set_xlabel("Numer of Punctuations")
g.set_ylabel("Vews log")

plt.subplot(222)
g1 = sns.boxplot(x='count_punctuations', y='likes_log',data=df_yout)
g1.set_title("Likes by Ponctuations")
g1.set_xlabel("Numer of Punctuations")
g1.set_ylabel("Likes log")

plt.subplot(223)
g2 = sns.boxplot(x='count_punctuations', y='dislikes_log',data=df_yout)
g2.set_title("Dislikes by Ponctuations")
g2.set_xlabel("Numer of Punctuations")
g2.set_ylabel("Dislikes log")

plt.subplot(224)
g3 = sns.boxplot(x='count_punctuations', y='comment_log',data=df_yout)
g3.set_title("Comments by Ponctuations")
g3.set_xlabel("Numer of Punctuations")
g3.set_ylabel("Comments log")

plt.subplots_adjust(wspace = 0.2, hspace = 0.4,top = 0.9)

plt.show()
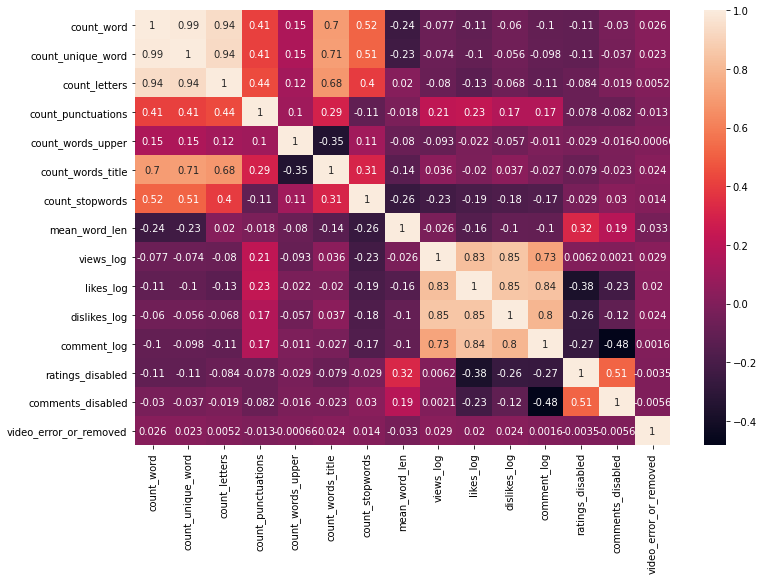
plt.figure(figsize = (12,8))

sns.heatmap(df_yout[['count_word', 'count_unique_word','count_letters',
                     "count_punctuations","count_words_upper", "count_words_title",
                     "count_stopwords","mean_word_len",
                     'views_log', 'likes_log','dislikes_log','comment_log',
                     'ratings_disabled', 'comments_disabled', 'video_error_or_removed']].corr(), annot=True)
plt.show()
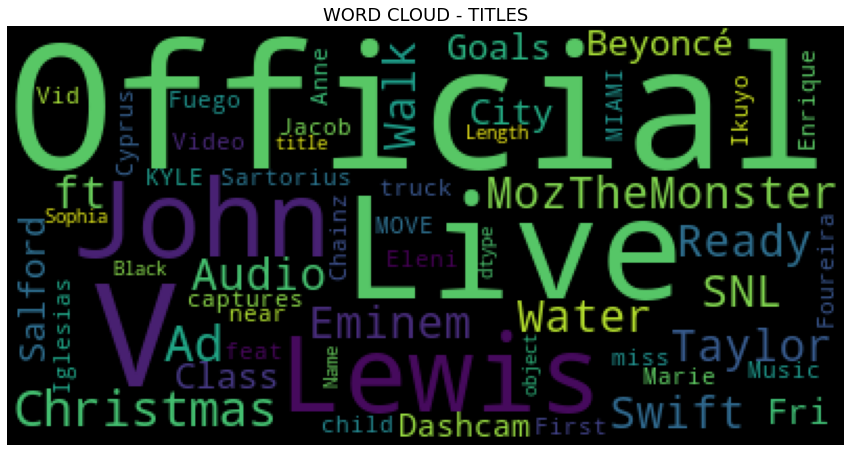
Visualizing the Word Cloud of Tagged videos
- Ratings Disable
- Comments Disable
- Video Error or Removed
mpl.rcParams['font.size']= 15
mpl.rcParams['savefig.dpi']= 100
mpl.rcParams['figure.subplot.bottom']= .1
plt.figure(figsize = (15,15))

stopwords = set(STOPWORDS)

wordcloud = WordCloud(
                          background_color='black',
                          stopwords=stopwords,
                          max_words=1000,
                          max_font_size=120,
                          random_state=42
                         ).generate(str(df_yout['title']))

print(wordcloud)
fig = plt.figure(1)
plt.imshow(wordcloud)
plt.title("WORD CLOUD - TITLES")
plt.axis('off')
plt.show()
<wordcloud.wordcloud.WordCloud object at 0x7f58cef0ecd0>
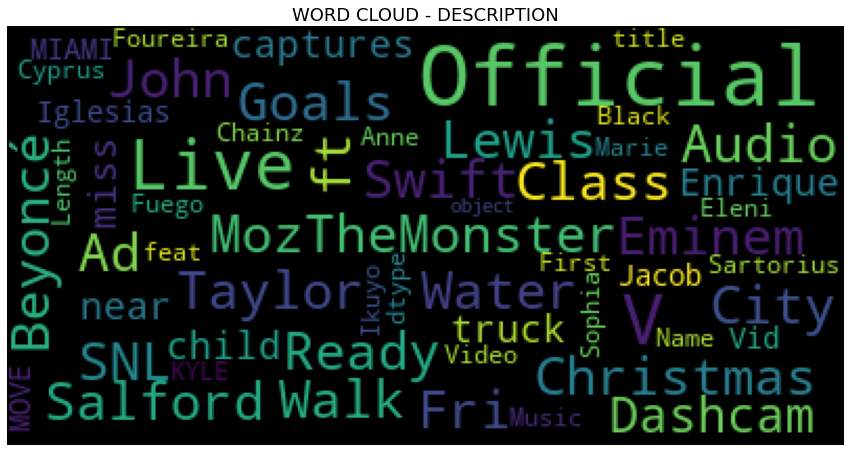
plt.figure(figsize = (15,15))

stopwords = set(STOPWORDS)
wordcloud = WordCloud(
                          background_color='black',
                          stopwords=stopwords,
                          max_words=150,
                          max_font_size=40,
                          random_state=42
                         ).generate(str(df_yout['title']))

print(wordcloud)
fig = plt.figure(1)
plt.imshow(wordcloud)
plt.title("WORD CLOUD - DESCRIPTION")
plt.axis('off')
plt.show()
<wordcloud.wordcloud.WordCloud object at 0x7f58cef0ef90>
plt.figure(figsize = (15,15))
stopwords = set(STOPWORDS)
newStopWords= ['https', 'youtube', 'VIDEO','youtu','CHANNEL', 'WATCH']
stopwords.update(newStopWords)
wordcloud = WordCloud(
background_color='black',
stopwords=stopwords,
max_words=1200,
max_font_size=80,
random_state=42
).generate(str(df_yout['description']))
print(wordcloud)
fig = plt.figure(1)
plt.imshow(wordcloud)
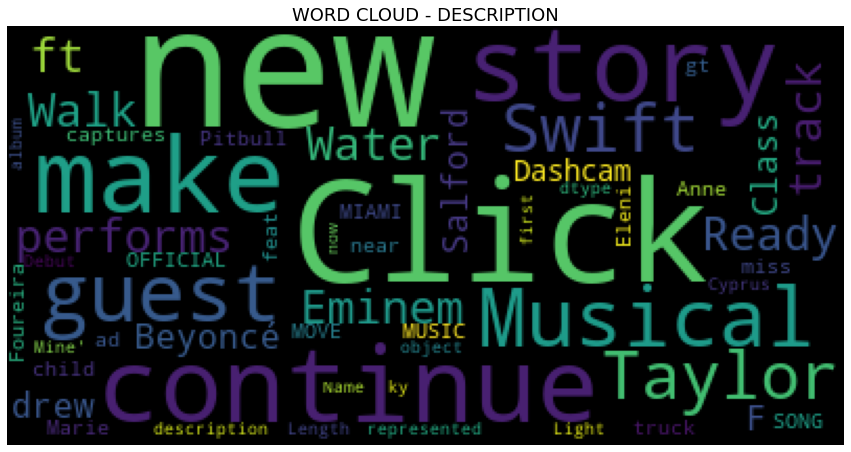
plt.title("WORD CLOUD - DESCRIPTION")
plt.axis('off')
plt.show()
<wordcloud.wordcloud.WordCloud object at 0x7f58d6688e50>
plt.figure(figsize = (15,15))
stopwords = set(STOPWORDS)
wordcloud = WordCloud(
background_color='black',
stopwords=stopwords,
max_words=1200,
max_font_size=120,
random_state=42
).generate(str(df_yout['tags']))
print(wordcloud)
fig = plt.figure(1)
plt.imshow(wordcloud)
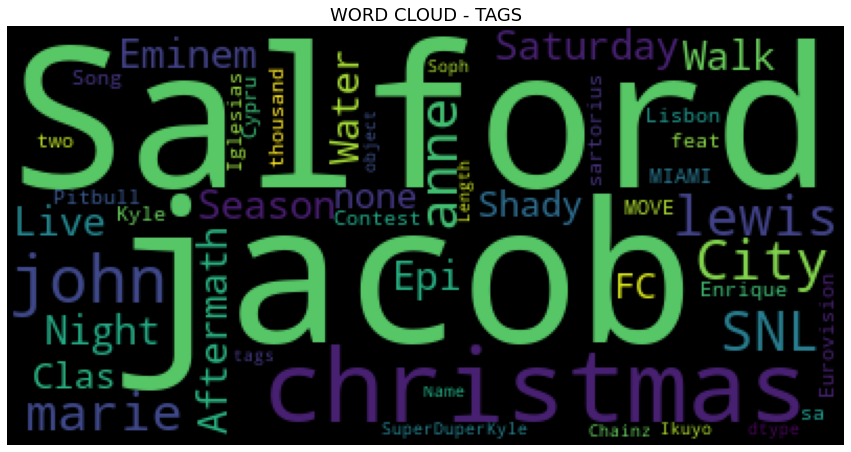
plt.title("WORD CLOUD - TAGS")
plt.axis('off')
plt.show()
<wordcloud.wordcloud.WordCloud object at 0x7f58cedbd9d0>
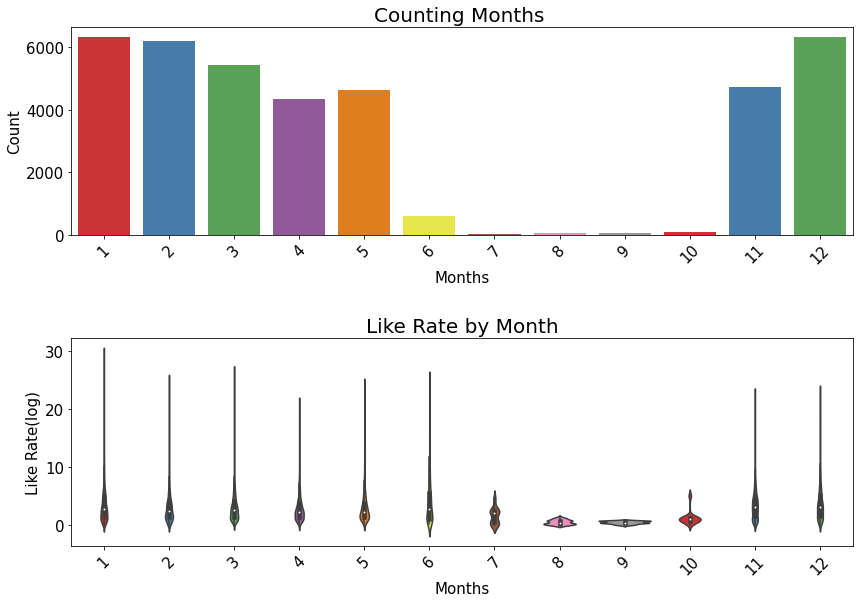
df_yout['publish_time'] = pd.to_datetime(df_yout['publish_time'], format='%Y-%m-%dT%H:%M:%S.%fZ')
df_yout['month'] = df_yout['publish_time'].dt.month

print("Category Name count")
# print(df_yout['month'].value_counts()[:5])

plt.figure(figsize = (14,9))

plt.subplot(211)
g = sns.countplot('month', data=df_yout, palette="Set1")
g.set_xticklabels(g.get_xticklabels(),rotation=45)
g.set_title("Counting Months ", fontsize=20)
g.set_xlabel("Months", fontsize=15)
g.set_ylabel("Count", fontsize=15)

plt.subplot(212)
g1 = sns.violinplot(x='month', y='like_rate', data=df_yout, palette="Set1")
g1.set_xticklabels(g.get_xticklabels(),rotation=45)
g1.set_title("Like Rate by Month", fontsize=20)
g1.set_xlabel("Months", fontsize=15)
g1.set_ylabel("Like Rate(log)", fontsize=15)

plt.subplots_adjust(hspace = 0.5, top = 0.9)

plt.show()
Category Name count


/opt/conda/lib/python3.7/site-packages/seaborn/_decorators.py:43: FutureWarning: Pass the following variable as a keyword arg: x. From version 0.12, the only valid positional argument will be `data`, and passing other arguments without an explicit keyword will result in an error or misinterpretation.
  FutureWarning
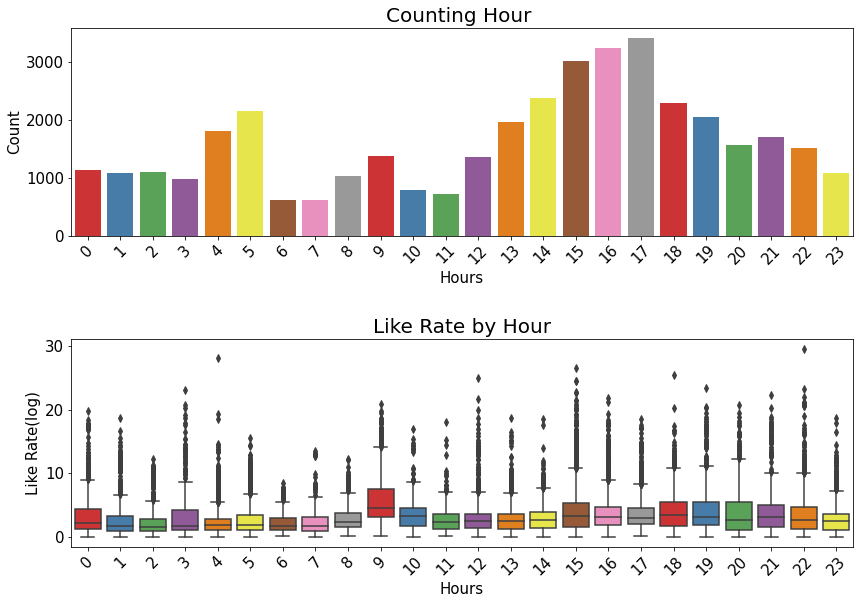
# separates date and time into two columns from 'publish_time' column
df_yout.insert(4, 'publish_date', df_yout['publish_time'].dt.date)
df_yout['publish_time'] = df_yout['publish_time'].dt.time
df_yout[['hour','min','sec']] = df_yout['publish_time'].astype(str).str.split(':', expand=True).astype(int)
plt.figure(figsize = (14,9))

plt.subplot(211)
g = sns.countplot('hour', data=df_yout, palette="Set1")
g.set_xticklabels(g.get_xticklabels(),rotation=45)
g.set_title("Counting Hour ", fontsize=20)
g.set_xlabel("Hours", fontsize=15)
g.set_ylabel("Count", fontsize=15)

plt.subplot(212)
g1 = sns.boxplot(x='hour', y='like_rate', data=df_yout, palette="Set1")
g1.set_xticklabels(g.get_xticklabels(),rotation=45)
g1.set_title("Like Rate by Hour", fontsize=20)
g1.set_xlabel("Hours", fontsize=15)
g1.set_ylabel("Like Rate(log)", fontsize=15)

plt.subplots_adjust(hspace = 0.5, top = 0.9)

plt.show()
/opt/conda/lib/python3.7/site-packages/seaborn/_decorators.py:43: FutureWarning: Pass the following variable as a keyword arg: x. From version 0.12, the only valid positional argument will be `data`, and passing other arguments without an explicit keyword will result in an error or misinterpretation.
  FutureWarning